
Originally posted at the Public Policy Institute of CA.
By Mark Baldassare, Dean Bonner, David Kordus, and Lunna Lopes.
Californians view traffic congestion as a big problem in most regions.
- The majority of Californians (58%) say traffic congestion on freeways and major roads is a big problem in their region, consistent with our findings in July 2006 (64%). Californians are most likely to see traffic congestion as a big problem in Los Angeles County (73%), the San Francisco Bay Area (63%), and the Inland Empire and Orange/San Diego Counties (62% each). In contrast, only 36% of Central Valley residents hold this view. Across racial/ethnic and income groups, at least 50% say congestion is a big problem. African Americans are much more likely than other racial/ethnic groups to hold this view.
Perception that traffic congestion is a big problem in your region
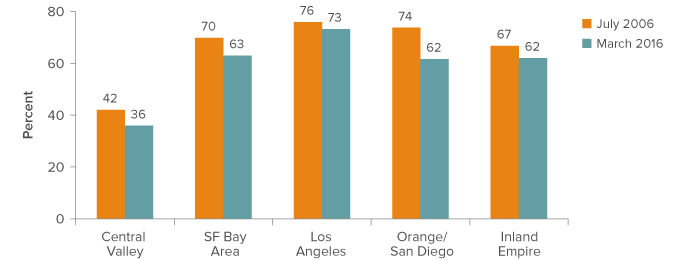
SOURCE: PPIC Statewide Survey, July 2006 and March 2016. For July 2006, the margin of error for all adults is ±2.0%; for March 2016, it is ±3.6%. The margins of error for subgroups are larger.
Two-thirds of Californians commute by driving alone.
- Most working Californians (68%) say they usually commute by driving alone—about the same as in July 2006 (70%). Across regions, San Francisco Bay Area (24%) and Los Angeles County (11%) residents are the most likely to commute by public bus or transit. The overwhelming majority of residents in the Central Valley (86%) and the Inland Empire and Orange/San Diego Counties (84% combined) either drive alone or carpool.
How do you usually commute to work?
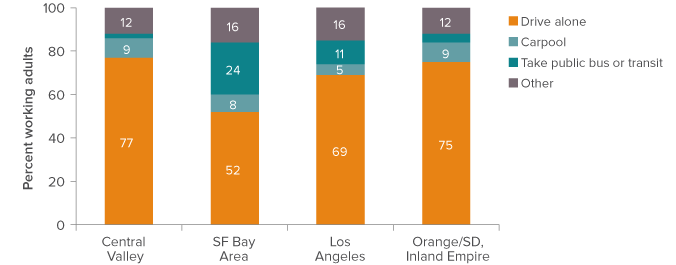
SOURCE: PPIC Statewide Survey, May 2016. Margin of error for all adults is ±3.3%. The margins of error for subgroups are larger.
NOTE:Other category includes walking, bicycling, working at home, and other volunteered responses.

A majority say spending more on road, highway, and bridge maintenance is very important.
- Governor Brown has identified $57 billion of deferred maintenance needs in the state’s transportation infrastructure system, and he called a special legislative session in 2015 to address the issue. At least 60% of Californians across parties and regions say that spending more money on California’s roads, highways, and bridges is very important for the future quality of life and economic vitality of the state. Among all adults, 62% say this is very important, compared to 53% in March 2015. However, only 35% of Californians support Governor Brown’s budget proposal after hearing a description of his plan to fund infrastructure projects with a new vehicle fee and an increase in the state gasoline tax.
Public transit and freeways are top priorities for transportation funding.
- When asked which surface transportation projects should be given top priority for additional state funding, Californians tend to say either public bus and transit (34%) or freeways and highways (33%). Fewer say local streets and roads (24%) or carpool lanes (6%). But there are partisan and regional differences. Compared to Democrats, Republicans are much more likely to prioritize freeways over other transportation projects; independents are about equally likely to prioritize either freeways or transit. Half of San Francisco Bay Area residents prioritize public transit, while half of Inland Empire residents prioritize freeways.
Top priority for additional state funding for surface transportation projects
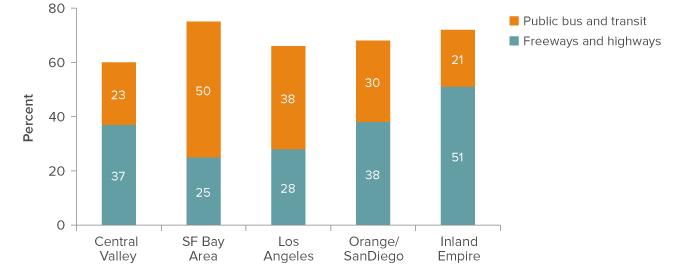
SOURCE: PPIC Statewide Survey, March 2016. Margin of error for all adults is ±3.6%. The margins of error for subgroups are larger.
Most Californians prefer using the budget surplus or bonds to fund infrastructure.
- When asked how they would increase current state funding for roads and infrastructure projects, a plurality of adults prefer to use only surplus budget funds (31%), and an additional 24% prefer to issue state bonds. Fewer say they prefer to increase vehicle registration fees (17%) or the state gasoline tax (13%). Likely voters have nearly identical preferences. While Democrats are divided between using surplus funds and issuing state bonds (26% each), Republicans (39% to 21%) and independents (40% to 20%) favor using surplus funds over issuing bonds by about a two-to-one margin. This preference is also prevalent among residents of the Central Valley (39% to 19%) and the Inland Empire (37% to 17%); Californians in other regions are more evenly divided.
Preference for how to increase funding for roads and other infrastructure
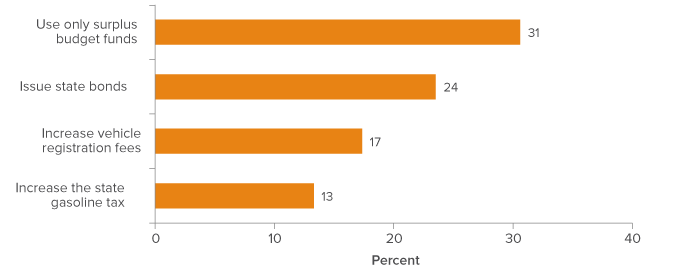
SOURCE: PPIC Statewide Survey, January 2016. Margin of error for all adults is ±3.5%. The margins of error for subgroups are larger.
Majorities support a state bond and oppose local sales tax to fund transportation projects.
- Sixty-one percent of adults and 52% of likely voters say they would vote for a bond measure on the state ballot to pay for surface transportation projects. Majorities of Democrats and independents, and majorities across regions, would vote yes, but a majority of Republicans would vote no. Fewer than half of adults and likely voters say they would vote for an increase in their local sales tax to fund transportation projects, far short of the two-thirds majority required to pass. Support falls below 50% in each region. Across parties, only a majority of Democrats would vote yes.
Support for transportation funding measures

SOURCE: PPIC Statewide Survey, May 2016. Margin of error for all adults is ±3.3%. The margins of error for subgroups are larger.