
Originally posted at the Public Policy Institute of CA.
By Magnus Lofstrom and Brandon Martin.
California has a large number of diverse—and aging—county jail facilities.
California’s counties operate several types of jails, including court holding facilities, temporary holding facilities, and long-term facilities. All counties except Alpine operate at least one long-term facility, for a total of 123 facilities across the state. More than half of these facilities were built before 1990.
The jail population is largely male and being held for felonies.
Men make up the vast majority of the jail population (87%). More than 63% of inmates are either awaiting arraignment, trial, or sentencing. Inmates held on either a felony charge or conviction account for 85% of the jail population.
Corrections realignment created new pressures for county jails.
Since realignment began in October 2011, county jails have had oversight over most non-serious, non-violent, non-sexual felons and parolees who violate their parole. Before realignment, the maximum sentence in county jail was one year. Now that lower-level felons go to county jail, this practice has changed—there is no limit on the amount of time these offenders can serve.
After an extended period of decline, realignment increased jail populations …
After reaching a high of 84,275 inmates in September 2007, the monthly average daily jail population declined steadily to 71,777 inmates in September 2011—a decrease of 15%, or 12,498 inmates. After realignment began in October 2011, the jail population began to rise; as of October 2014—the month before the passage of Proposition 47—it stood at 82,005 inmates, a gain of 14%. As of October 2014, the statewide average daily jail population was about 2,000 inmates over the rated capacity—set by the California Board of State and Community Corrections—of 80,000 inmates. To address these capacity constraints, counties released 14,321 pre-sentenced and sentenced inmates in October 2014—4,102 (or 40%) more than in September 2011. On the important issue of inmate, staff, and visitor safety, we only have data on the number of inmate assaults on staff, which increased from 703 in the first nine months of 2011 to 1,074 in the same time period of 2014. Data is unavailable for inmate-on-inmate assaults and officer use of force.
… but Proposition 47 brought relief to crowding problems.
Voters approved Proposition 47 in November 2014, reclassifying several property and drug crimes from felonies to misdemeanors. Prop 47 had an immediate impact: the average daily population dropped by almost 10,000 between October 2014 and January 2015. The jail population has remained relatively flat since January 2015, and as of December 2015 it stands at 72,501 inmates, a decrease of 9,504 (or 12%) from October 2014. At the end of 2015, 32 jails were over state rated capacity, compared to 53 jails in October 2014. Correspondingly, early releases have dropped to 7,827 inmates in December 2015—a staggering 45% decrease from October 2014. Violent inmates may still pose a problem to jail officers and administrators. During the first nine months of 2015, there were 1,101 inmate assaults on staff, up from 1,074 during the same period in 2014.
County jail populations grew after realignment but dropped dramatically after Proposition 47
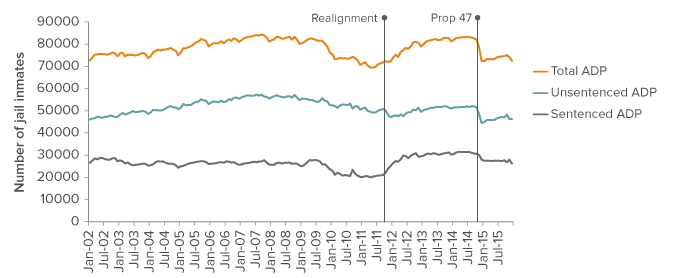

SOURCE: Jail Profile Survey, January 2002–December 2015, Board of State and Community Corrections.
NOTE: ADP = Average daily population.
The state continues to provide assistance to provide new jail facilities.
California has made more than $2.5 billion available for county jail construction. Funding programs in AB 900 (2007), SB 1022 (2012), SB 863 (2014), and SB 844 (2016) are paying for additional or replacement jail facilities in almost every California county. In addition to new or replacement jail beds, counties will have much-needed space for medical, educational, and other services that can help prepare inmates for successful reentry into the community. The drop in inmate population levels after Proposition 47 should be considered when planning long-term jail bed needs, especially given the cost and length of time of construction.
Capacity-constrained releases have fallen since the passage of Proposition 47
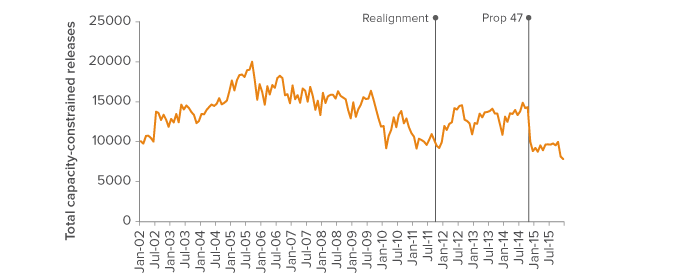
SOURCE: Jail Profile Survey, January 2002–December 2015, Board of State and Community Corrections.
NOTE: Release figures include both non-sentenced and sentenced inmates.
Sources: Jail Profile Survey 2002–2015, BSCC Rated Capacity by Facility and Jail Construction Date: Board of State and Community Corrections (BSCC).