

Originally posted at the Public Policy Institute of CA.
By Brandon Martin, Magnus Lofstrom, and Joseph Hayes.
Research shows that increased police staffing is a cost-effective way to prevent crime.
The most recent credible research finds that an additional police officer reduces crime by 1.3 violent crimes and 4.2 property crimes per year. Other recent evidence estimates that the crime-reducing benefits of hiring an additional police officer exceed $300,000 per year, much more than the annual cost of an additional officer. With California’s incarceration rates declining since the implementation of public safety realignment and Proposition 47, adding law enforcement staff is one cost-effective strategy to look at.
Californians share national concerns about community-police relationships.
Community-police relationships have recently become a focus of national attention, as incidents across the country have brought concerns about the treatment of racial and ethnic minorities by law enforcement to the forefront. According to the January 2016 PPIC Statewide Survey, 61% of Californians think that blacks and other minorities do not receive equal treatment relative to whites in the criminal justice system, up 6 percentage points from the January 2015 survey. This opinion is held by majorities across racial/ethnic groups (Asians, blacks, Latinos, and whites), from 55% of whites to 92% of blacks.
Almost half of California’s law enforcement officers work for municipal police departments.
In 2015 there were more than 118,000 full-time law enforcement employees in California; roughly 77,000 were sworn law enforcement officers (with full arrest powers) and 41,000 were civilian staff. About 48% of sworn officers were municipal police officers, 39% were county sheriff officers, and almost 10% were with the California Highway Patrol (CHP). About 3% were employed by other agencies, such as university, port, and transportation districts and the State Department of Parks and Recreation.
Sworn officers are predominately non-jail employees, and most are male.
In 2014, there were roughly 66,500 non-jail (patrol) and 10,500 sworn jail officers. Of the 77,000 total sworn officers, 67,000 (or 87%) were males. In 2014, there were 29,500 non-jail and 11,500 jail civilian staff. Of the roughly 41,000 civilian staff, only 15,000 (or 37%) were males.
Staffing has not fully rebounded since the Great Recession.
The number of law enforcement staff began to decline in California at the onset of the Great Recession. Between 2008 and 2015, the state lost 4,051 sworn staff and 1,293 civilian staff—5% and 3% of 2008 totals, respectively. The number of sworn officers per 100,000 California residents dropped from 221 in 2008 to 198 in 2015. Looking at the numbers across agency types for 2008 to 2015, we see that police officers are down almost 7%, sheriff’s deputies are down 4%, and other officers are down almost 3%. The number of highway patrol officers was slightly higher in 2015 than it was in 2008, but that is because the CHP did not experience drastic cuts until 2010. Between 2010 and 2015, the CHP lost 6% of officers.
California’s law enforcement officer staffing has not rebounded since the Great Recession
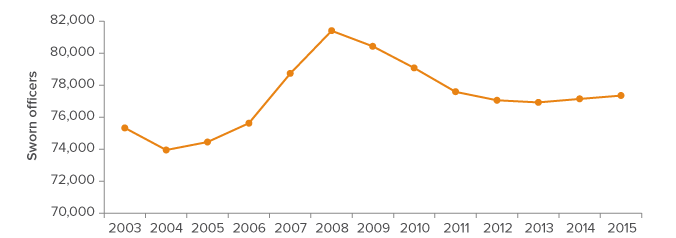

SOURCE: California Department of Justice’s Criminal Justice Profiles 2003–2012 and Crime in California 2013–2015, Criminal Justice Full-Time Personnel.
Law enforcement funding is mainly a local concern.
Police protection constitutes a very small percentage (less than 1%) of direct expenditures by the state, but accounts for a larger amount (between 5% and 15%) of annual budgets at county and city levels. Local (city and county) police protection is funded by property, business, and sales taxes, federal and state grants, local fees and fines, and voter-approved increases in general and special sales taxes. In 2012, California law enforcement agencies spent $14.8 billion ($454 per resident) for police protection, slightly more than the $13.7 billion the state and counties spent on corrections. For comparison, Florida spent $7.3 billion ($438 per resident), New York $9.3 billion ($507 per resident), and Texas $6.5 billion ($273 per resident), respectively, on police protection in 2012.
California has more officers per 100,000 residents than its neighbors
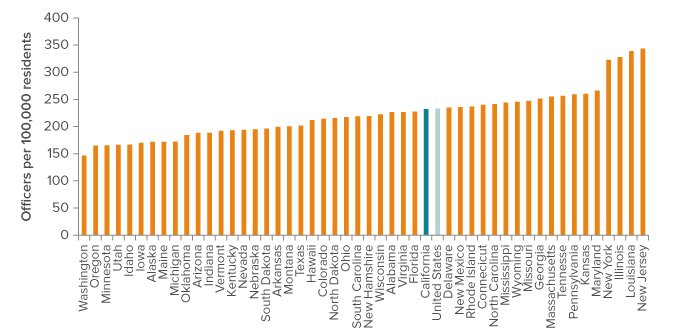
SOURCE: Federal Bureau of Investigation’s Crime in the U.S. 2014, Police Employee Data.
[divider] [/divider]
NOTES: Rates for West Virginia—which did not submit full information to the FBI in 2014—and the District of Columbia are not included in this figure (and they are not factored into the US-wide rate of officers per 100,000 residents). Because these rates include information only from agencies that reported to the FBI, they may not match other sources.
Sources: Aaron Chalfin and Justin McCrary, “Are U.S. Cities Underpoliced? Theory and Evidence,” Review of Economics and Statistics, forthcoming. Paul Heaton, “Hidden in Plain Sight: What Cost-of-Crime Research Can Tell Us about Investing in Police” (RAND Corporation, 2010). California Department of Justice, Crime in California, 2003–2015. California Department of Finance, County Population Estimates, 2003–2015. Federal Bureau of Investigation, Crime in the United States, 2003–2014; United States Bureau of Justice Statistics, Justice Expenditures Program, 2012. California Legislative Analyst’s Office, “California’s Criminal Justice System: A Primer” (2013).