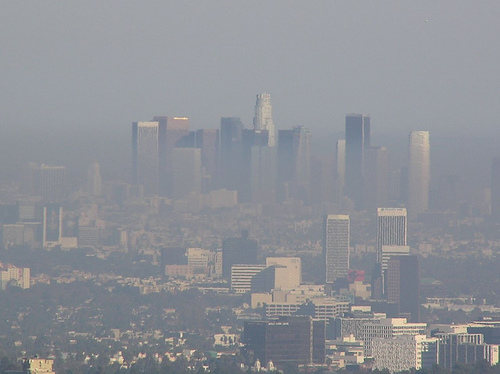
Beginning in 2000, the American Lung Association (ALA) has periodically released its “State of the Air” report. The report gives letter grades to counties in the country based on air quality. But despite being well intentioned, some local government officials believe the report has a number of flaws that result in unfair grading.
The ALA uses stricter air quality standards than the EPA when determining grades for ambient air quality. The report measures ozone, short-term particle pollution, and year-round particle pollution. Days are given color values such as “Orange” and “Red” to represent how healthy or unhealthy the air was, and are weighted so that a “Very Unhealthy” day affects the grade for the district more drastically than an “Unhealthy” day.
The exact number of unhealthy days allowed varies dependent on how bad the day is. For example, to receive an “F” in the report, a county would need only between 6 and 7 “Unhealthy” or “Red” days in 3 years. Under these standards, one nearby forest fire could theoretically result in a failing grade for the three years of the report.
Although carefully executed, the report still lacks reasonable accommodations for these abnormal circumstances, which can result in grades that don’t reflect normal conditions in the area. Mat Ehrhardt of the Yolo-Solano Air Quality Management District concurs, stating, “We disagree with the methodology, and we’ve had some conversations with the ALA about it.”
According to their website, the ALA halved the number of unhealthy days allowed by the National Ambient Air Quality Standards (NAAQS) for short-term particle pollution over three years.
Local air officials would like to see the ALA adopt the EPA’s system, or something similar, which discards certain days from their grading system that are deemed to be an “exceptional event”. However, the ALA disagrees.
When speaking with PublicCEO, Bonnie Holmes-Gen, Executive Director of Air Quality and Public Health for the ALA in California, stated that the ALA’s report provides a more accurate snapshot of air conditions than the EPA. She said this is because they don’t discard any days, and they take the severity of air pollution into consideration.
She went on to say that they account for abnormal circumstances by using three years worth of data in each report, and also by providing trend data that tracks regional air quality over time.
While this system should help control for minor aberrations in the data, it doesn’t seem to be enough to control for an extreme circumstance such as a wildfire.
Furthermore, the report only grades around the top twenty-five best and worst cities (read: metropolitan areas). From there, judgment is levied at the county level.
It is easy to imagine that there are many clean and healthy cities within the boundaries of a failing county all over the country. However, cost of data collection is surely a barrier in this instance.
Regardless of fairness or methodology, the “State of the Air” grades are cited in publications across the nation. It is not unreasonable to think that families and businesses take them into consideration when choosing a location to live and work, a point that Mr. Ehrhardt made when speaking with PublicCEO. And if a grade does not accurately represent the normal conditions in a region, then the grade could unjustifiably have a negative impact on the area.
Polluted or Polluters?
Another issue with the report is who receives the failing grade.
The “State of the Air” report, like most other reports and articles, addresses the most polluted cities and counties and fails to point the finger at the cities and counties who pollute the most. This subtle distinction is the difference between getting to the root of the problem or simply looking at the consequences of it.
The California Air Resources Board documented the damaging impact that air pollution from upwind cities, such as San Francisco, can have on downwind areas throughout Northern and Central California. The report, titled “Ozone Transport: 2001 Review,” states, “Pollutants carried by the wind from the Bay Area to surrounding areas have a major impact on air quality in those areas.” In the most extreme circumstance, the report states, “High ozone concentrations at Healdsburg, in the North Coast, are entirely due to emissions transported from the Bay Area.”
Ms. Holmes-Gen acknowledged that transported pollution does have a big effect on other areas’ grades, stating, “It’s definitely a big factor, and why we have to consider air pollution as everybody’s problem.”
Despite flaws, local officials like Mr. Erhardt still believe the report helps draw attention to an important issue. They recognize that the ALA makes air quality information easily accessible and understandable to the public.
Regardless of any misgivings, the ALA does not plan to change its methodology for gathering data before the release of its next “State of the Air” report, due out in April.


