By Wendell Cox – Visiting Professor, Conservatoire National des Arts et Metiers, Paris.
A few recent days driving the Los Angeles freeways impressed me with how different they are from in most other places in the country. The intensity of the traffic is astounding. Even on the weekend, travel over Sepulveda Pass on the San Diego Freeway (I-405) was highly congested. Traffic really never stopped, but frustratingly inched along for parts of the way and approached 60 miles per hour on other parts. A Saturday trip I feared might take an hour and a half was completed from Simi Valley in less than 60 minutes. Caltrans and the local officials do an admirable job of keeping the traffic moving, which was obvious from the only slight delay near Sherman Way caused by an incident that required a fire truck.
Traffic Per Lane Mile
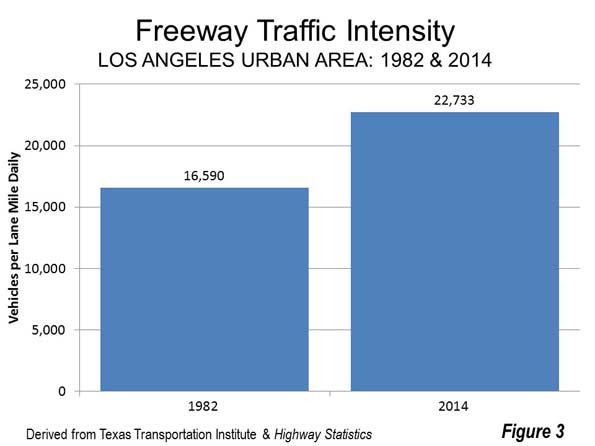
The latest Federal Highway Administration data indicates that nearly 23,000 cars are handled by each freeway lane on the average day. Among the larger urban areas, only San Jose and close-by Riverside-San Bernardino have a volume of more than 20,000 daily.
The freeway lane volume in Los Angeles is up from 16,500 cars per lane mile in the early 1980s, a more 37 percent increase in traffic (Figure 1). This is not surprising, because the urban area, which stretches from the San Fernando Valley to Pomona and Orange County to San Clemente has added almost the same percentage of residents. The city of Los Angeles itself, which covers virtually the same area as it did more than three decades ago has become significantly more dense, also adding about one third to its population.

At the same time, public policy in California is calling for significant urban densification that will put an even greater strain on the roadway network. Any assumption that a more dense Los Angeles will be anything less than an even more horrific traffic environment is simply folly.
Billions Spent on Rail: Yet Traffic is Much Worse
Some, including me while I was on the Los Angeles County Transportation Commission, believe (or in my case “believed”) that an expansion of transit — especially adding urban rail service, would relieve traffic congestion. Los Angeles has now had nearly three decades of experience with that strategy. Yet, traffic has only become more intense.
Indeed, despite the addition of a substantial urban rail system in Los Angeles County has been accompanied by a general decline in transit ridership on the Metropolitan Transportation Authority services compared to predecessor services operated by the Southern California Rapid Transit District in 1985. In 2016, ridership was even lower than the year before, despite the extensions of rail service to Santa Monica on the Expo Line and to Azusa on the Gold Line.
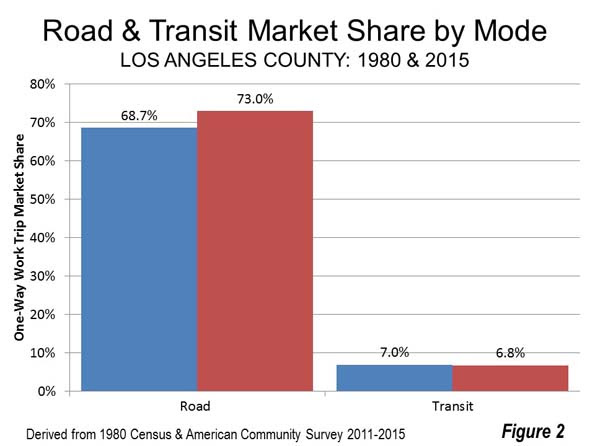
Even work trip ridership, which transit serves best, is down. In 1980, transit’s market share was 7.0 percent in Los Angeles County. By 2015, transit’s market share had fallen slightly to 6.8 percent. Meanwhile, driving alone expanded significantly from 68.7 percent in 1980 to 73.0 percent in 2015. Working at home increased from 1.5 percent in 1980 to 5.1 percent in 2015 (Figure 2).

Why Rail has Not Attracted Drivers
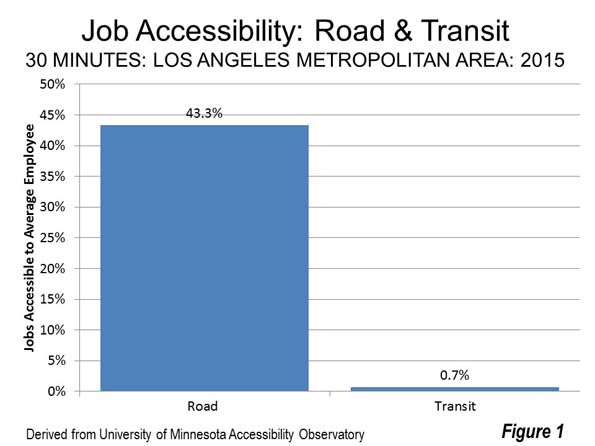
There are two principal reasons the transit has not been able to attract drivers out of their cars and reduce freeway volumes. The first is that, for the most part, you cannot get from here to there on transit. That is, most jobs and places people are traveling cannot be conveniently accessed by transit. The University of Minnesota Accessibility Laboratory has found that 43.3 percent of jobs in the Los Angeles metropolitan area can be reached by car within 30 minutes. By contrast. Only 0.7 percent of jobs can be reached by transit within 30 minutes. In other words, the accessibility provided by cars is much greater than that of transit. For every job that can be reached by transit within 30 minutes, nearly 60 times as many jobs can be reached by car (Figure 3).

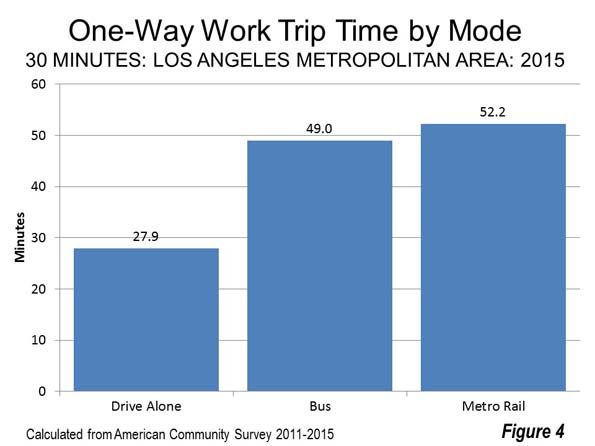
Even where jobs can be reached by transit, it takes far longer. According to the latest American Community Survey data, the average one way work trip travel time for people driving alone in the Los Angeles metropolitan area is 27.9 minutes. By contrast, the average Metro Rail rider takes 52.2 minutes to reach work (Figure 4). It is not hard to imagine why people have not traded in their faster car travel times for slower trips on transit. Excess travel time, regardless of how traveled, takes away from other necessary activities and recreation.

Further, with all the talk about “urban villages,” with the expected improved jobs housing balance, it is well to recognize such an achievement would be unprecedented. As former principal planner of the World Bank Alain Bertaud put it: “…the urban village “model does not exist in the real world because it contradicts the economic justification of large cities: the efficiency of large labor markets.” The cold water of reality is that “… the urban village model exists only in the mind of urban planners.”
Of course, talk of people living near where they work is dubious, particularly in a metropolitan area where housing affordability is challenging both for the vast majority of renters and potential buyers. When does anyone think this will happen? In “this life” or maybe in the “life to come?”
The bottom line, unfortunate and politically incorrect as it is, is that transit simply cannot reduce traffic congestion. Some other strategy needs to be deployed.
Prognosis: More Density, More Traffic
Los Angeles traffic is likely to get much worse, especially if the development becomes substantially denser. All of the 12 world urban areas in the recent Tom Tom Congestion Index that have worse traffic than Los Angeles are denser. This is consistent with the international evidence that shows a strong association between higher densities, greater traffic congestion and lengthened work trip travel times. The experience in Los Angeles shows the same thing.
[divider] [/divider]
Cross-posted at New Geography & Fox & Hounds Daily.


